
Timelaps for Alcohol & Spirits
Continuous brand tracking for alcohol and spirits brands.
Continuous brand tracking for alcohol and spirits brands.
People are drinking less and choosing more carefully, so brand equity decides the fewer occasions that remain. Timelaps tracks how your brand is known, considered, and seen as worth it, against every rival for the moment, continuously, in every market you operate.
Beverage leaders know the importance of branding.
The same conversations happen inside every customer-centric beverage brand we talk to.
Legacy brand tracking is breaking.
Occasions and tastes shift with every season and social trend. Legacy tracking audits annually. A full holiday season too late.
Slow time to value.
Slow time to value.
Slow time to value.
Price tags built for multi-billion
incumbents, not challengers.
Price tags built for multi-billion
incumbents, not challengers.
Price tags built for multi-billion
incumbents, not challengers.
Social buzz mistaken for real,
representative demand.
Social buzz mistaken for real,
representative demand.
Social buzz mistaken for real,
representative demand.
Require additional resources
to make sense of the data.
Require additional resources
to make sense of the data.
Require additional resources
to make sense of the data.
A viral moment you can feel but cannot measure.
A viral moment you can feel but cannot measure.
A viral moment you can feel but cannot measure.
Insights that arrive after the decision.
Insights that arrive after the decision.
Insights that arrive after the decision.


Brand tracking on auto-pilot.
AI-native brand intelligence, built for alcohol & spirits brands.

Cheaper
5x more accessible than traditional alternatives.

Better
Research-grade insights from 4,000 real consumers.

Faster
Set up in days.
Always-on. Self-updating.

What makes Timelaps different?
What makes Timelaps different?
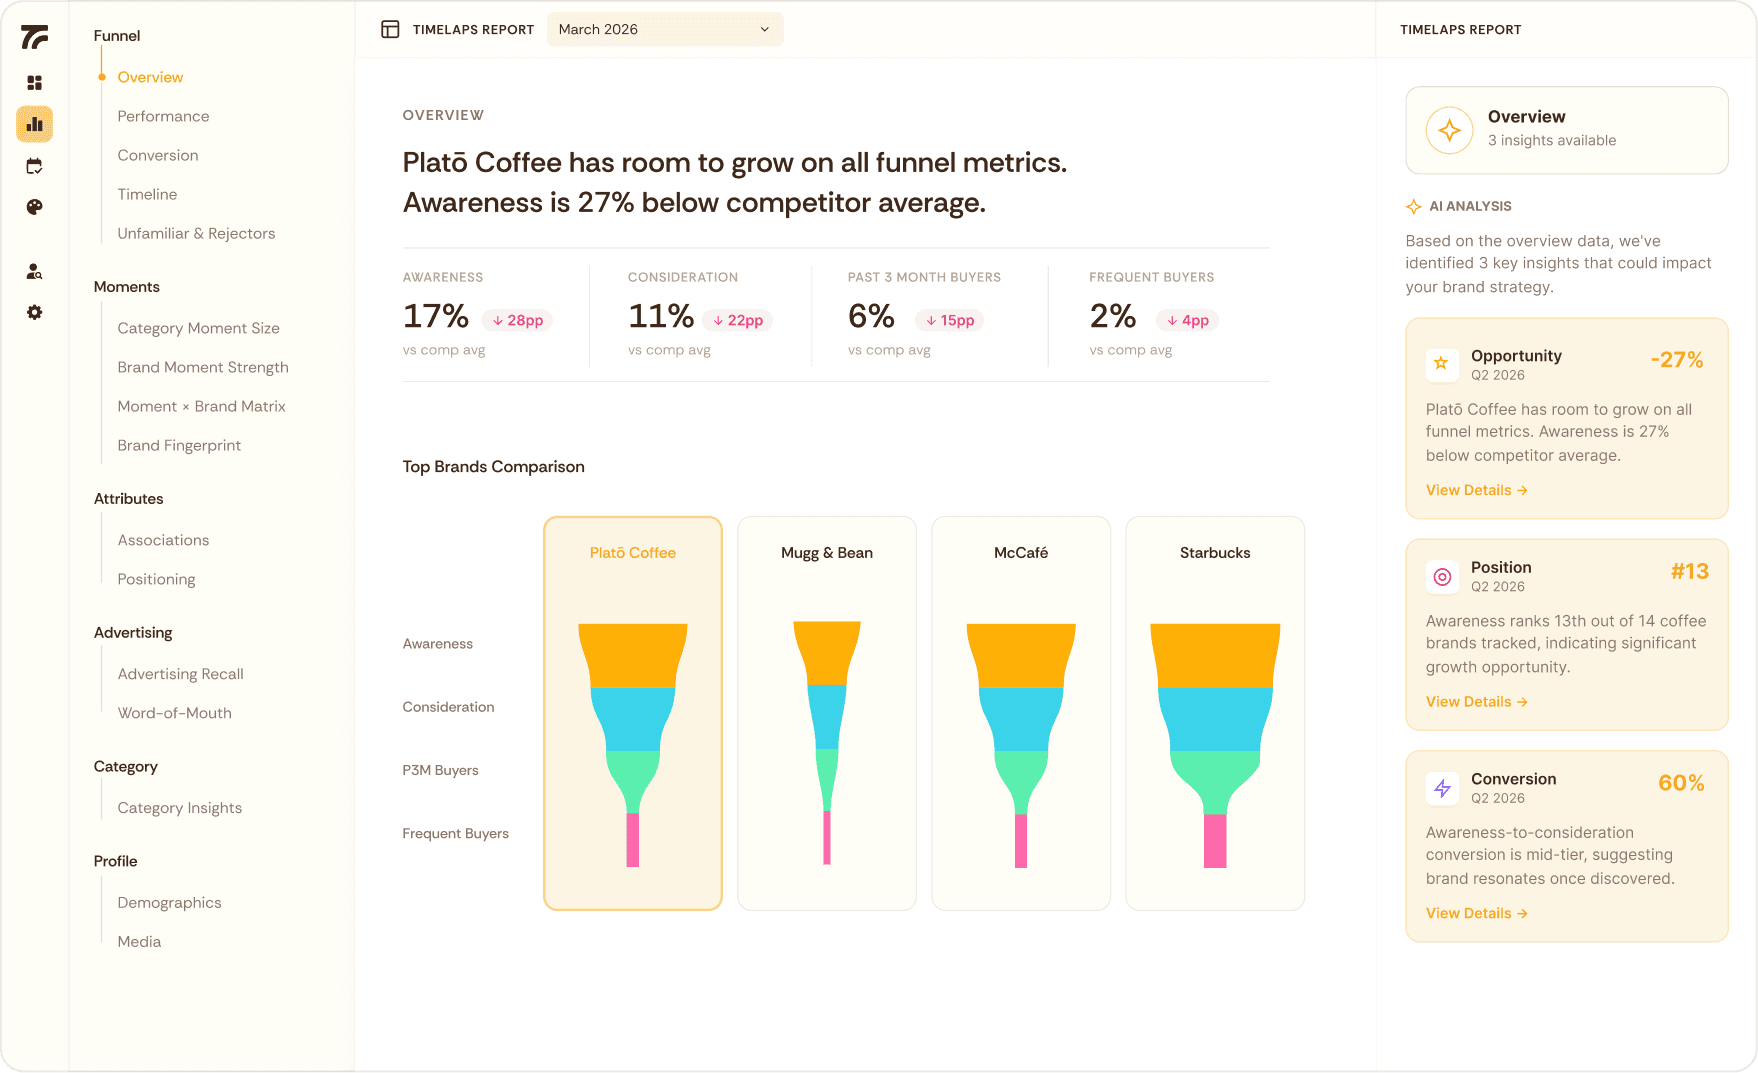
Timelaps is a modern brand tracking and insight platform designed to replace slower, more expensive traditional agency tracking with always-on insights.
Without Timelaps
Slow. Expensive. Stale.
How traditional brand tracking holds Bev-Alc brands back.

3-6 months to first insight.
Quarterly updates. Decisions made with out of date data.
Six-figure price tags. Most companies are priced out.
Rigor depends on which analyst you get.
Insights buried in dense PPTs.
With Timelaps
Real-time. Accessible. Always-on.
How modern Bev-Alc brands actually operate.

Set up in days, not months.
Always-on. Continuous tracking.
At least 5x more affordable than traditional agencies.
Research-grade with the latest brand science built-in.
Board-ready, self-updating dashboard.

Without Timelaps
Slow. Expensive. Stale.
How traditional brand tracking holds Bev-Alc brands back.
3-6 months to first insight.
Quarterly updates. Decisions made with out of date data.
Six-figure price tags. Most companies are priced out.
Rigor depends on which analyst you get.
Insights buried in dense PPTs.
With Timelaps
Real-time. Accessible. Always-on.
How modern Bev-Alc brands actually operate.
Set up in days, not months.
Always-on. Continuous tracking.
At least 5x more affordable than traditional agencies.
Research-grade with the latest brand science built-in.
Board-ready, self-updating dashboard.
Without Timelaps
Slow. Expensive. Stale.
How traditional brand tracking holds Bev-Alc brands back.
3-6 months to first insight.
Quarterly updates. Decisions made with out of date data.
Six-figure price tags. Most companies are priced out.
Rigor depends on which analyst you get.
Insights buried in dense PPTs.
With Timelaps
Real-time. Accessible. Always-on.
How modern Bev-Alc brands actually operate.
Set up in days, not months.
Always-on. Continuous tracking.
At least 5x more affordable than traditional agencies.
Research-grade with the latest brand science built-in.
Board-ready, self-updating dashboard.
Fast set-up,
ongoing value.
Onboard in days. Get actionable insights from real consumers in your category continuously.

01
Set up your tracker
Our AI analyst and brand research expert co-design your study. Tailored to your brand, category, and market.
02
03
04
Fast set-up,
ongoing value.
Onboard in days. Get actionable insights from real consumers in your category continuously.
01
Set up your tracker
Our AI analyst and brand research expert co-design your study. Tailored to your brand, category, and market.
02
Always-on fieldwork
Your tracker never stops collecting. Quality-controlled responses from 4,000+ real consumers in your category are selected.
03
Continuous insights
Your dashboard self-refreshes monthly with actionable insights and beautiful visualizations.
04
Share & Act
Share a dynamic storytelling dashboard, instead of a stale PDF, directly with your team.
Fast set-up,
ongoing value.
Onboard in days. Get actionable insights from real consumers in your category continuously.
01
Set up your tracker
Our AI analyst and brand research expert co-design your study. Tailored to your brand, category, and market.
02
Always-on fieldwork
Your tracker never stops collecting. Quality-controlled responses from 4,000+ real consumers in your category are selected.
03
Continuous insights
Your dashboard self-refreshes monthly with actionable insights and beautiful visualizations.
04
Share & Act
Share a dynamic storytelling dashboard, instead of a stale PDF, directly with your team.
Why drinks brands choose Timelaps.
See brand preference move in real-time with continuous data collection, so you win the exact occasions that matter.

Own the drink moments that matter most.
Date night. Promotion celebration. Friday group outing. Track which drinking moments (category entry points) your brand owns and which ones a rival, or a no-and-low alternative, is quietly taking.

Prove you're worth the trade-up.
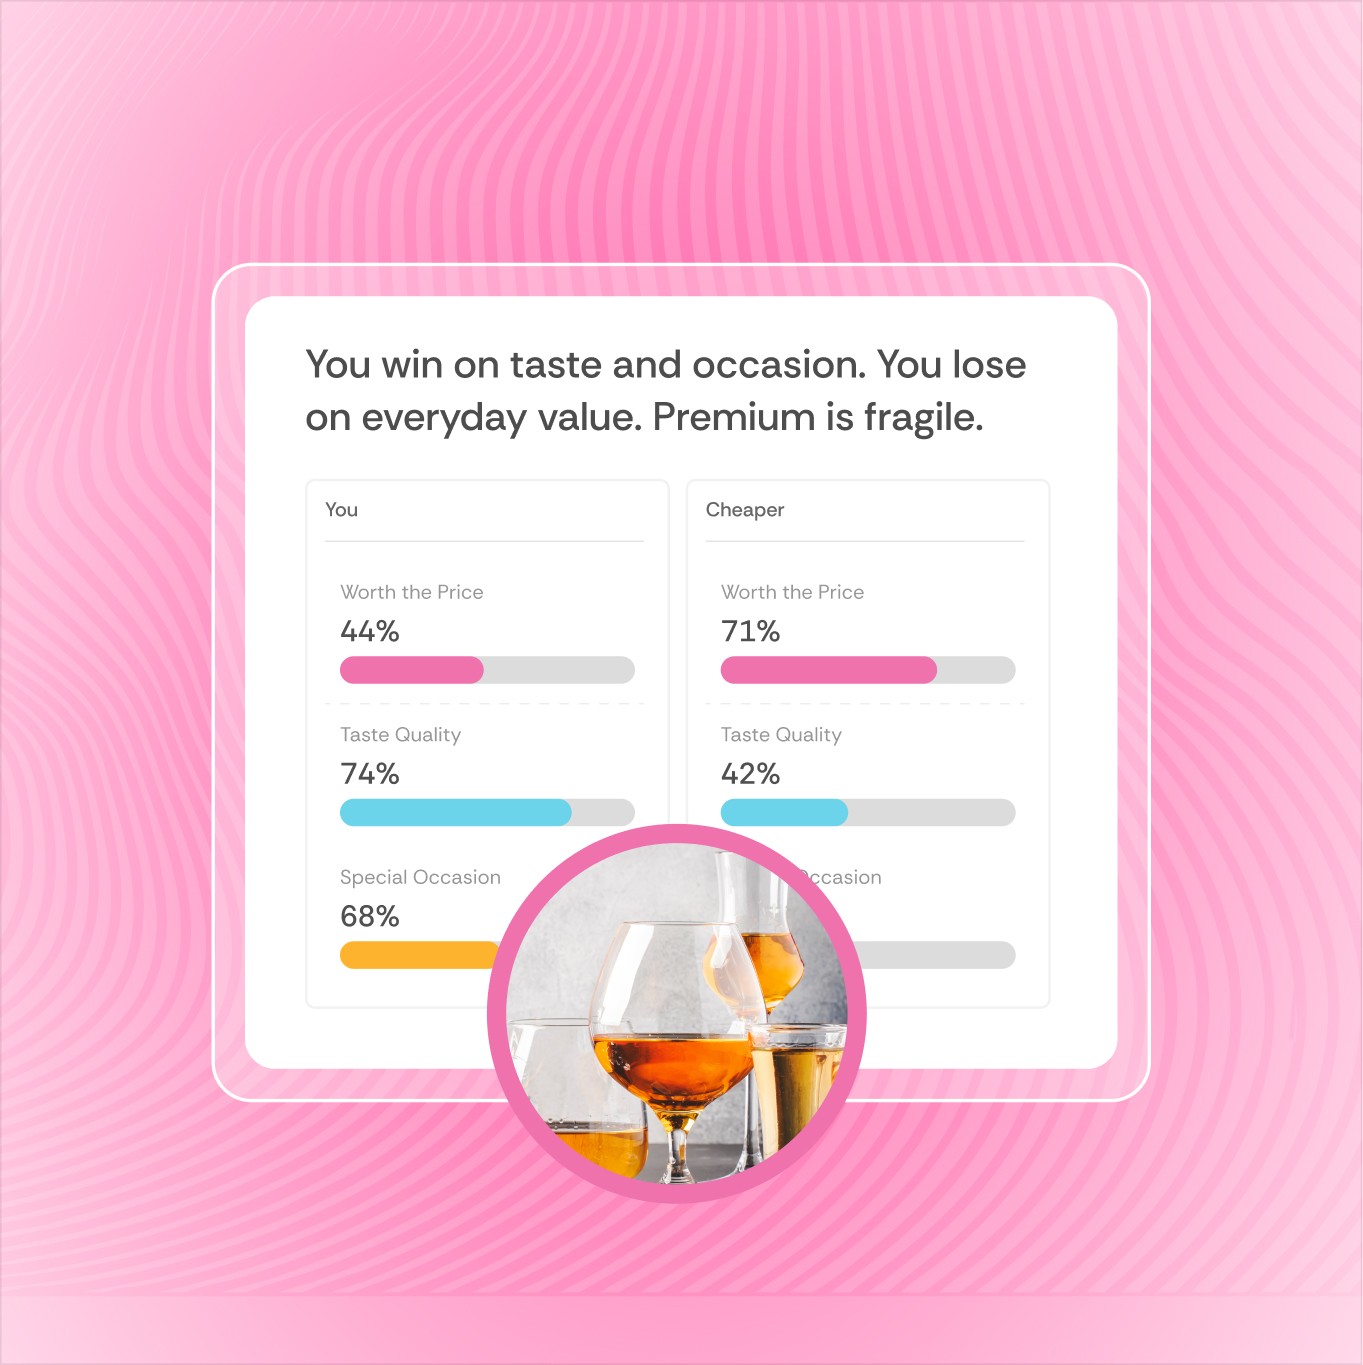
Premiumization now has to be justified glass by glass. Track whether category buyers see you as worth the price, against the cheaper bottle beside you.
Read the next generation before they pass you by.
New legal-age drinkers judge on values, health, and authenticity. Track how they see you, beyond the loyal buyers aging with the brand.
The Alcohol & Spirits category is ready to shift toward modern brand intelligence.
As people drink less, brand equity decides the fewer occasions that remain. Yet the strength that wins the trade-up goes unmeasured.

-4%
Broad premiumisation has stalled, driving a 4% decline in global spirits value. Multinational brands must shift from high-margin luxury positioning to aggressively protecting volume and category relevance.
Source: IWSR Global Market Data Release, 2026
-4%
60% of brand sales is projected to be done by wholesale, far ahead of brand’s own stores (11%) and websites (6%), pushing brand discovery onto a shelf where you don’t own the data.
Source: IWSR Global Market Data Release, 2026

52-78%
RTDs and non-alcoholic alternatives have captured a massive 52% to 78% mental penetration among younger consumers (ages 21–34). Legacy brands are losing market share simply by failing to track and attach their equity to these casual consumption moments.
Source: Morning Consult, 2025

11%
Only 11% of marketers can comprehensively prove the business impact of their brand marketing
Source: Marketing Week, 2025
FAQs.
Can’t find the answer you’re looking for?
Reach out to our team: hello@timelaps.io.
Can you track which occasions we own?
Yes. We map drinking moments as Category Entry Points: the celebration, the gift, the Friday pour. Then we track which brands come to mind for each. With fewer occasions to win, you see exactly which ones are yours and which are slipping.
Can you measure whether people see our brand as worth trading up to?
Yes. We track worth-it perception directly: whether category buyers see your brand as justifying its price against the cheaper bottle beside it. As premiumization comes under pressure, you see whether your equity is holding the gap or losing it.
Can you measure how moderation and no-and-low trends are shifting perception of us?
Yes. We track how changing habits are reshaping your category and your brand's place in it, including among lighter and lapsed drinkers. You see the shift as it forms, not after the year's depletions confirm it.
Can you track how new legal-age drinkers perceive us on quality and values?
Yes. We read the newest cohort separately: how they see you on quality, authenticity, and values, and whether you're in their consideration set at all. That tells you whether the brand is renewing itself or aging with its buyers.
If we run a portfolio, can you track each brand against its own competitive set?
Yes. Each brand gets its own tracker and its own rivals, so the single malt is measured against single malts and the RTD against RTDs. You see the portfolio brand by brand, not as one blended read.
Can we use this to make the case to distributors and retailers?
Answer: Yes. Depletion data shows what shipped. We show what consumers actually want: awareness, consideration, and preference for your brand against everything else on that shelf, by market. That's the evidence a buyer responds to when you're arguing for placement.
How is the data collected, and what's your sample source, size, and representativeness?
We field continuous online surveys through Dynata, a leading global panel. Samples are census-matched on the dimensions that matter, so respondents reflect your real market, not just your current customers. On Scale, that's roughly 4,000 responses per category per year, refreshed monthly, so trends are stable and read in near real time rather than once a quarter.
What quality controls and fraud detection do you use?
Every response runs through multiple layers: attention and consistency checks, speeding and straight-lining detection, duplicate and bot screening, and panel-side fraud filters. Low-quality responses are removed before anything reaches your dashboard, so you're acting on clean data.
Can you track our brand in growth markets as we expand?
Yes. We run the same methodology in 82 markets, census-matched per country. As you push into markets where the category is still growing, you baseline the brand before launch and track the build as you invest.
FAQs.
Can’t find the answer you’re looking for?
Reach out to our team: hello@timelaps.io.
Can you track which occasions we own?
Yes. We map drinking moments as Category Entry Points: the celebration, the gift, the Friday pour. Then we track which brands come to mind for each. With fewer occasions to win, you see exactly which ones are yours and which are slipping.
Can you measure whether people see our brand as worth trading up to?
Yes. We track worth-it perception directly: whether category buyers see your brand as justifying its price against the cheaper bottle beside it. As premiumization comes under pressure, you see whether your equity is holding the gap or losing it.
Can you measure how moderation and no-and-low trends are shifting perception of us?
Yes. We track how changing habits are reshaping your category and your brand's place in it, including among lighter and lapsed drinkers. You see the shift as it forms, not after the year's depletions confirm it.
Can you track how new legal-age drinkers perceive us on quality and values?
Yes. We read the newest cohort separately: how they see you on quality, authenticity, and values, and whether you're in their consideration set at all. That tells you whether the brand is renewing itself or aging with its buyers.
If we run a portfolio, can you track each brand against its own competitive set?
Yes. Each brand gets its own tracker and its own rivals, so the single malt is measured against single malts and the RTD against RTDs. You see the portfolio brand by brand, not as one blended read.
Can we use this to make the case to distributors and retailers?
Answer: Yes. Depletion data shows what shipped. We show what consumers actually want: awareness, consideration, and preference for your brand against everything else on that shelf, by market. That's the evidence a buyer responds to when you're arguing for placement.
How is the data collected, and what's your sample source, size, and representativeness?
We field continuous online surveys through Dynata, a leading global panel. Samples are census-matched on the dimensions that matter, so respondents reflect your real market, not just your current customers. On Scale, that's roughly 4,000 responses per category per year, refreshed monthly, so trends are stable and read in near real time rather than once a quarter.
What quality controls and fraud detection do you use?
Every response runs through multiple layers: attention and consistency checks, speeding and straight-lining detection, duplicate and bot screening, and panel-side fraud filters. Low-quality responses are removed before anything reaches your dashboard, so you're acting on clean data.
Can you track our brand in growth markets as we expand?
Yes. We run the same methodology in 82 markets, census-matched per country. As you push into markets where the category is still growing, you baseline the brand before launch and track the build as you invest.
FAQs.
Can’t find the answer you’re looking for?
Reach out to our team: hello@timelaps.io.
Can you track which occasions we own?
Yes. We map drinking moments as Category Entry Points: the celebration, the gift, the Friday pour. Then we track which brands come to mind for each. With fewer occasions to win, you see exactly which ones are yours and which are slipping.
Can you measure whether people see our brand as worth trading up to?
Yes. We track worth-it perception directly: whether category buyers see your brand as justifying its price against the cheaper bottle beside it. As premiumization comes under pressure, you see whether your equity is holding the gap or losing it.
Can you measure how moderation and no-and-low trends are shifting perception of us?
Yes. We track how changing habits are reshaping your category and your brand's place in it, including among lighter and lapsed drinkers. You see the shift as it forms, not after the year's depletions confirm it.
Can you track how new legal-age drinkers perceive us on quality and values?
Yes. We read the newest cohort separately: how they see you on quality, authenticity, and values, and whether you're in their consideration set at all. That tells you whether the brand is renewing itself or aging with its buyers.
If we run a portfolio, can you track each brand against its own competitive set?
Yes. Each brand gets its own tracker and its own rivals, so the single malt is measured against single malts and the RTD against RTDs. You see the portfolio brand by brand, not as one blended read.
Can we use this to make the case to distributors and retailers?
Answer: Yes. Depletion data shows what shipped. We show what consumers actually want: awareness, consideration, and preference for your brand against everything else on that shelf, by market. That's the evidence a buyer responds to when you're arguing for placement.
How is the data collected, and what's your sample source, size, and representativeness?
We field continuous online surveys through Dynata, a leading global panel. Samples are census-matched on the dimensions that matter, so respondents reflect your real market, not just your current customers. On Scale, that's roughly 4,000 responses per category per year, refreshed monthly, so trends are stable and read in near real time rather than once a quarter.
What quality controls and fraud detection do you use?
Every response runs through multiple layers: attention and consistency checks, speeding and straight-lining detection, duplicate and bot screening, and panel-side fraud filters. Low-quality responses are removed before anything reaches your dashboard, so you're acting on clean data.
Can you track our brand in growth markets as we expand?
Yes. We run the same methodology in 82 markets, census-matched per country. As you push into markets where the category is still growing, you baseline the brand before launch and track the build as you invest.