
Timelaps for CPG
Continuous brand tracking for fast-moving CPG teams.
Continuous brand tracking for fast-moving CPG teams.
Challenger brands win by building a brand and a community faster than the incumbents can react. But brand is the hardest thing to prove, and the syndicated trackers were never built for you. Timelaps provides CPG brands research-grade, always-on brand intelligence at the most accessible price, so you know if your brand marketing is working.
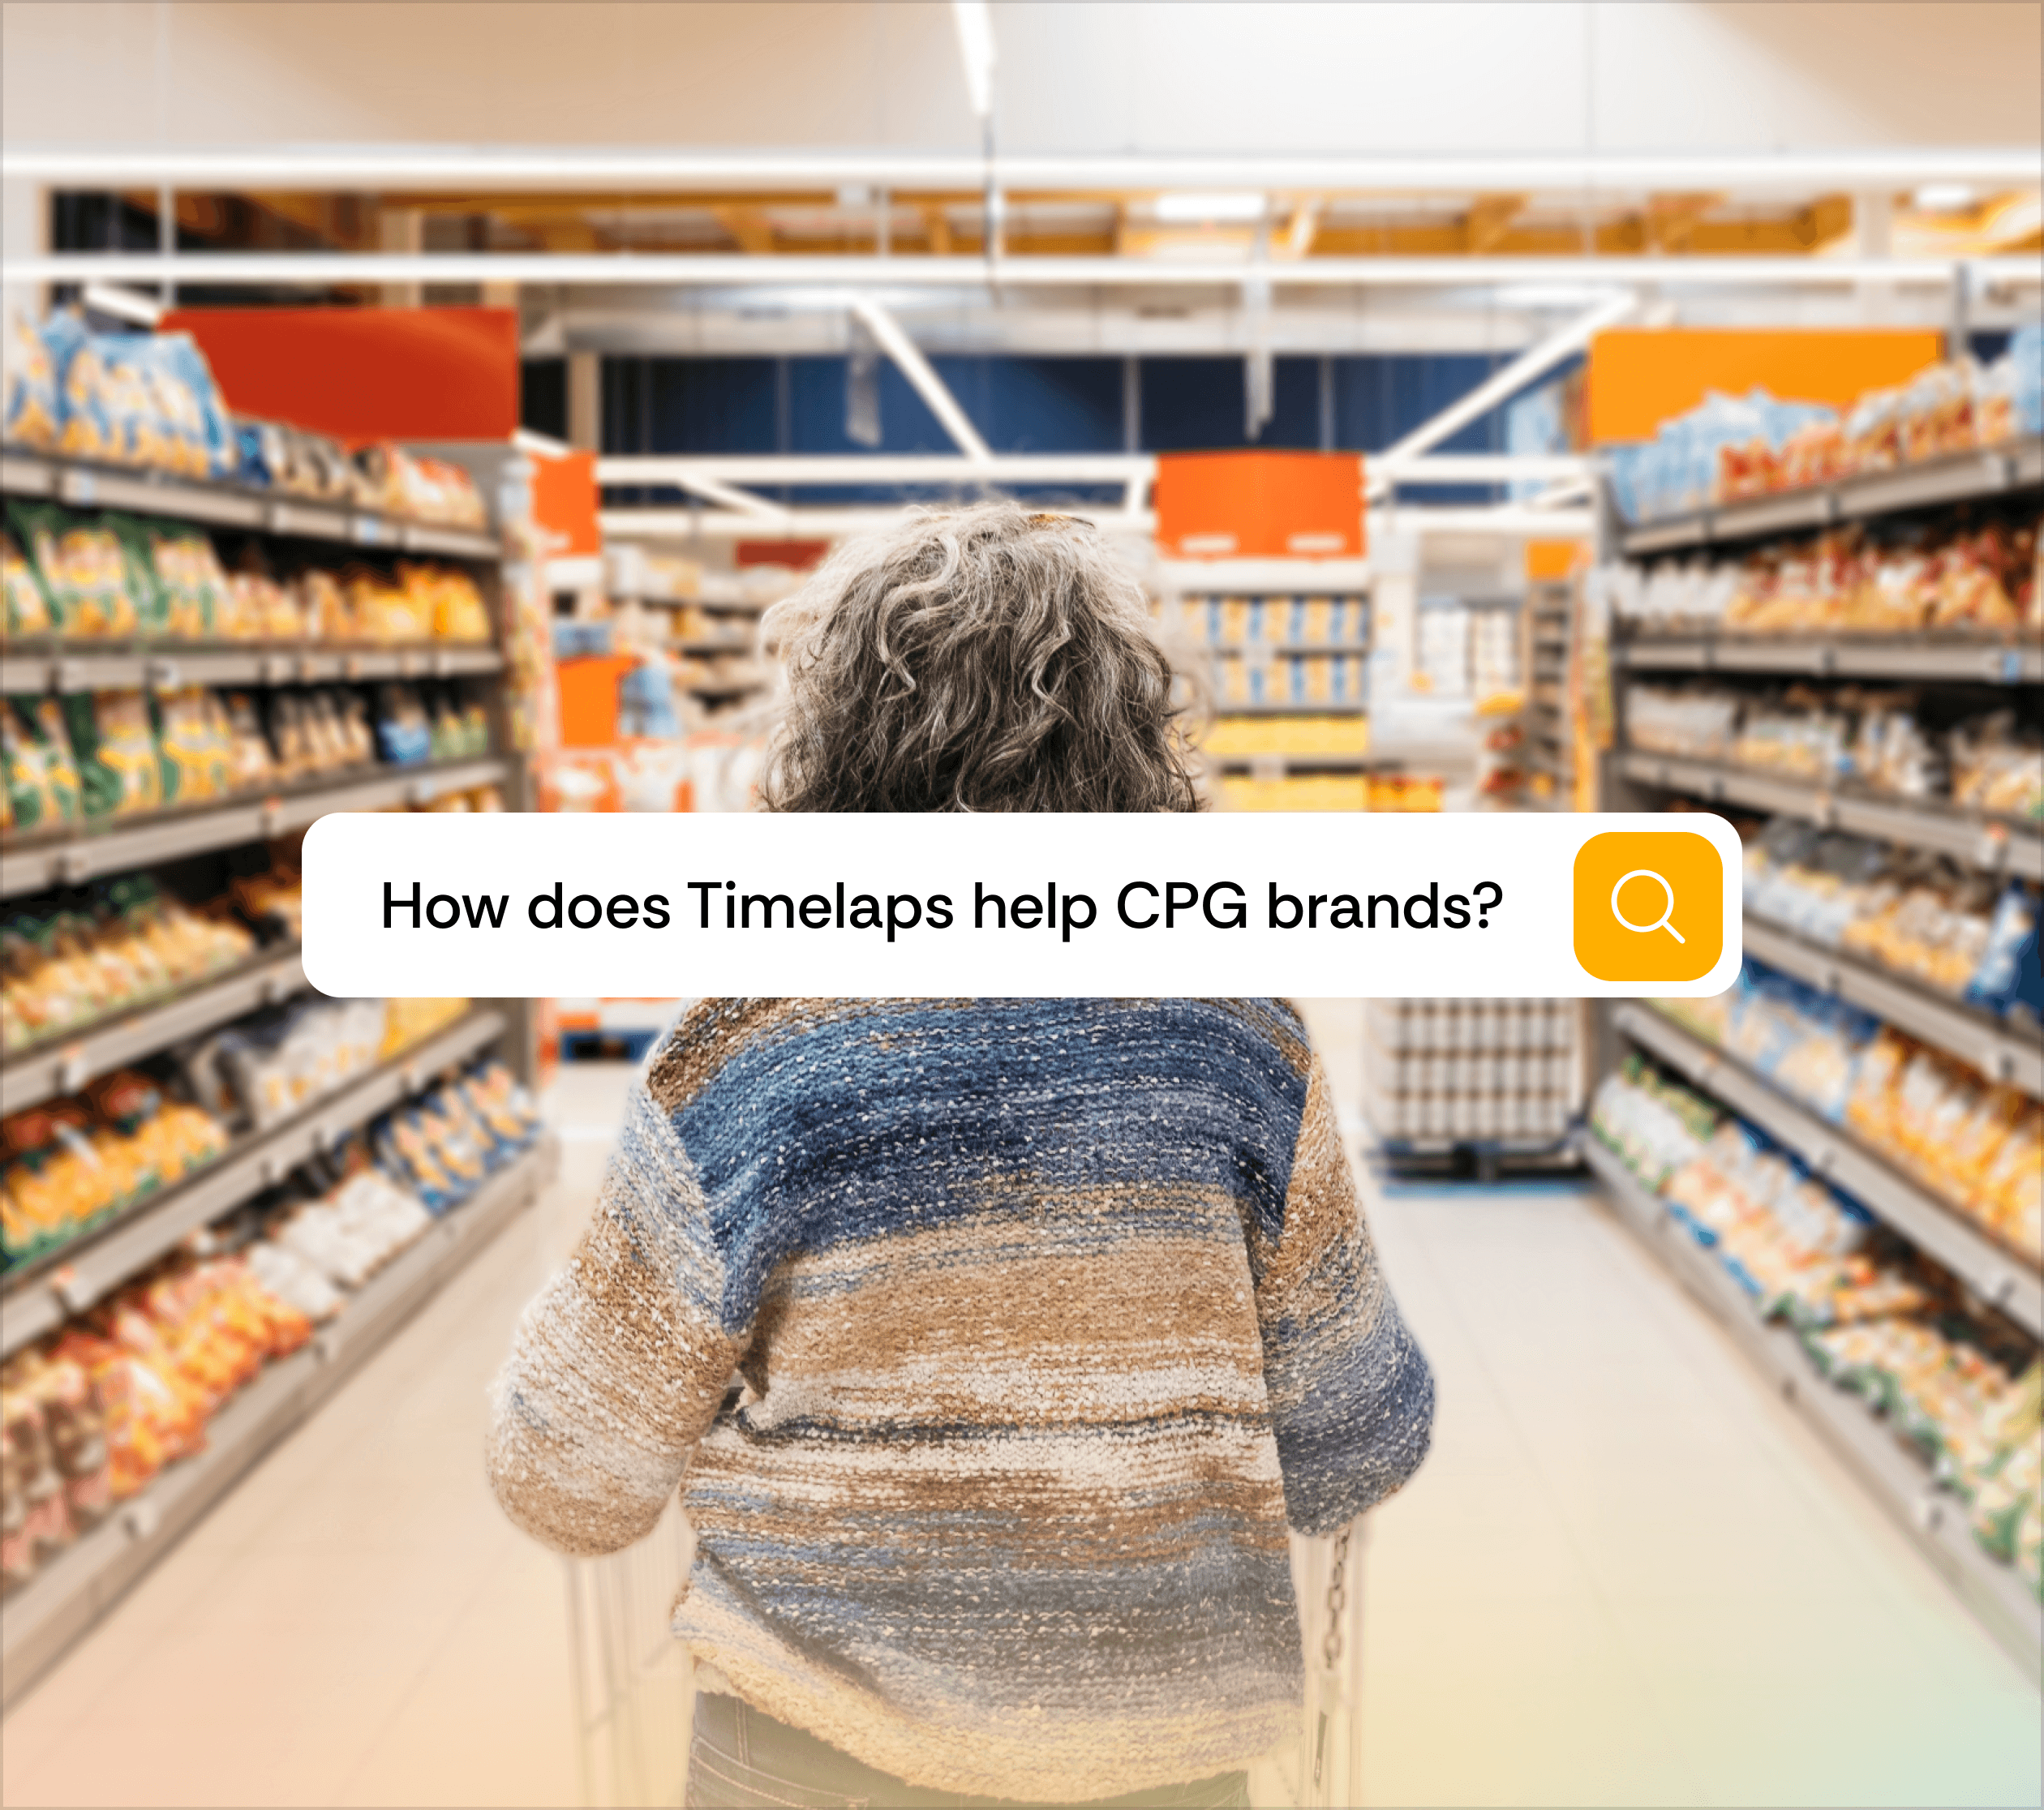
CPG leaders know the importance of branding.
The same conversations happen inside every CPG brand we talk to.
Legacy brand tracking is breaking.
Your category moves weekly. Your tracker moves every 3-6 months.
Slow time to value.
Slow time to value.
Slow time to value.
Price tags built for multi-billion
incumbents, not challengers.
Price tags built for multi-billion
incumbents, not challengers.
Price tags built for multi-billion
incumbents, not challengers.
Social buzz mistaken for real,
representative demand.
Social buzz mistaken for real,
representative demand.
Social buzz mistaken for real,
representative demand.
Require additional resources
to make sense of the data.
Require additional resources
to make sense of the data.
Require additional resources
to make sense of the data.
A viral moment you can feel but cannot measure.
A viral moment you can feel but cannot measure.
A viral moment you can feel but cannot measure.
Insights that arrive after the decision.
Insights that arrive after the decision.
Insights that arrive after the decision.


Brand tracking on auto-pilot.
AI-native brand intelligence, built for CPG pace and complexity.

Cheaper
5x more accessible than traditional alternatives.

Better
Research-grade insights from 4,000 real consumers.

Faster
Set up in days.
Always-on. Self-updating.

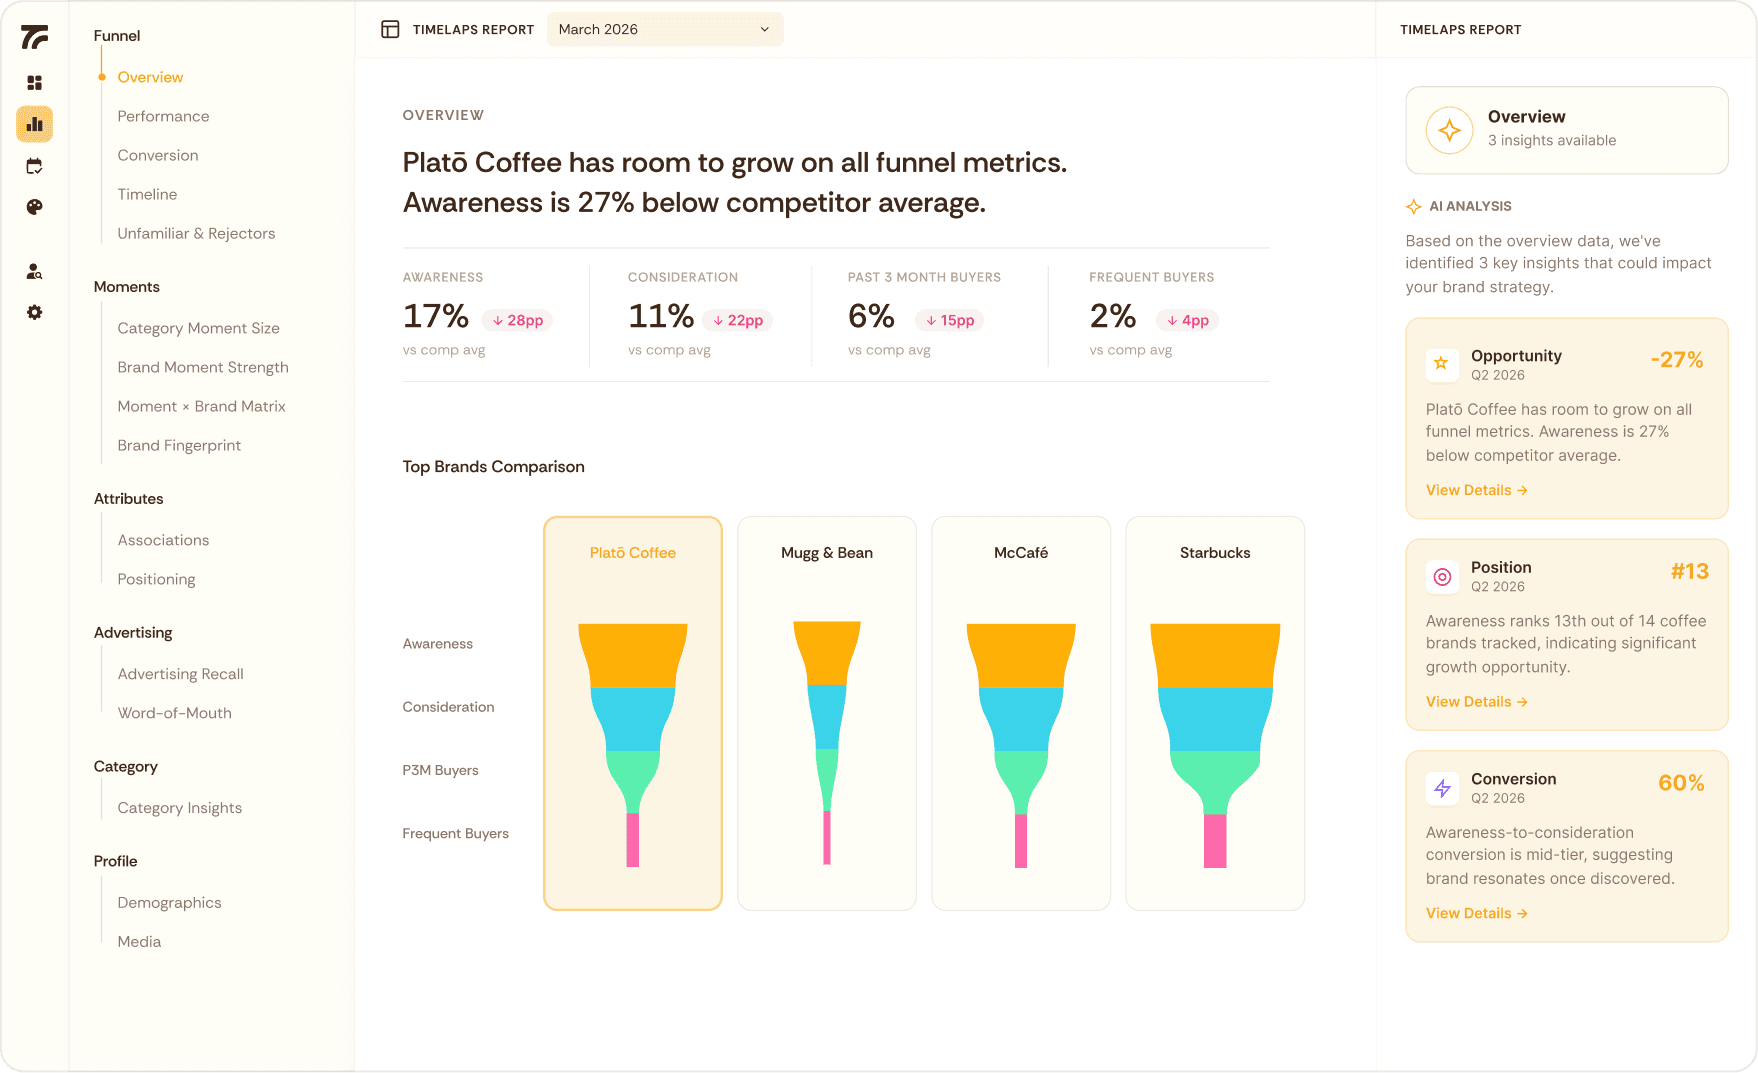
What makes Timelaps different?
What makes Timelaps different?
Timelaps is a modern brand tracking and insight platform designed to replace slower, more expensive traditional agency tracking with always-on insights.
Without Timelaps
Slow. Expensive. Stale.
How traditional brand tracking holds CPG teams back.

3-6 months to first insight.
Quarterly updates. Decisions made with out of date data.
Six-figure price tags. Most companies are priced out.
Rigor depends on which analyst you get.
Insights buried in dense PPTs.
With Timelaps
Real-time. Accessible. Always-on.
How modern CPG teams actually operate.

Set up in days, not months.
Always-on. Continuous tracking.
At least 5x more affordable than traditional agencies.
Research-grade with the latest brand science built-in.
Board-ready, self-updating dashboard.

Without Timelaps
Slow. Expensive. Stale.
How traditional brand tracking holds CPG teams back.
3-6 months to first insight.
Quarterly updates. Decisions made with out of date data.
Six-figure price tags. Most companies are priced out.
Rigor depends on which analyst you get.
Insights buried in dense PPTs.
With Timelaps
Real-time. Accessible. Always-on.
How modern CPG teams actually operate.
Set up in days, not months.
Always-on. Continuous tracking.
At least 5x more affordable than traditional agencies.
Research-grade with the latest brand science built-in.
Board-ready, self-updating dashboard.
Without Timelaps
Slow. Expensive. Stale.
How traditional brand tracking holds CPG teams back.
3-6 months to first insight.
Quarterly updates. Decisions made with out of date data.
Six-figure price tags. Most companies are priced out.
Rigor depends on which analyst you get.
Insights buried in dense PPTs.
With Timelaps
Real-time. Accessible. Always-on.
How modern CPG teams actually operate.
Set up in days, not months.
Always-on. Continuous tracking.
At least 5x more affordable than traditional agencies.
Research-grade with the latest brand science built-in.
Board-ready, self-updating dashboard.
Fast set-up,
ongoing value.
Onboard in days. Get actionable insights from real consumers in your category continuously.

01
Set up your tracker
Our AI analyst and brand research expert co-design your study. Tailored to your brand, category, and market.
02
03
04
Fast set-up,
ongoing value.
Onboard in days. Get actionable insights from real consumers in your category continuously.
01
Set up your tracker
Our AI analyst and brand research expert co-design your study. Tailored to your brand, category, and market.
02
Always-on fieldwork
Your tracker never stops collecting. Quality-controlled responses from 4,000+ real consumers in your category are selected.
03
Continuous insights
Your dashboard self-refreshes monthly with actionable insights and beautiful visualizations.
04
Share & Act
Share a dynamic storytelling dashboard, instead of a stale PDF, directly with your team.
Fast set-up,
ongoing value.
Onboard in days. Get actionable insights from real consumers in your category continuously.
01
Set up your tracker
Our AI analyst and brand research expert co-design your study. Tailored to your brand, category, and market.
02
Always-on fieldwork
Your tracker never stops collecting. Quality-controlled responses from 4,000+ real consumers in your category are selected.
03
Continuous insights
Your dashboard self-refreshes monthly with actionable insights and beautiful visualizations.
04
Share & Act
Share a dynamic storytelling dashboard, instead of a stale PDF, directly with your team.
Why CPG brands choose Timelaps.
For CPG teams, brand is the most valuable asset. You will feel this immediately.

Prove to retail your brand's worth
Walk into the retailer review with awareness and consideration numbers to prove your case.

See if the marketing campaign actually landed.
You put real budget behind that creator wave, that billboard, that rebrand, that event booth, that skit. Track the long-term brand lift it created, within weeks.

Track the whole category, not just your buyers.
CPG grows by reaching the category, not deepening a loyal few. Understand the silent majority and ones you’re missing, beyond the sales data and social signals.
The category is ready for the shift.
CPG leaders know the importance of brand in the AI era. Challenger growth is real and deals are always-on. Yet long-term brand building is winning the argument and losing the budget.

25%
60% of brand sales is projected to be done by wholesale, far ahead of brand’s own stores (11%) and websites (6%), pushing brand discovery onto a shelf where you don’t own the data.
Source: Bain & Company, 2026

11%
11% of marketers can comprehensively prove the business impact of their brand marketing.
Source: Marketing Week 2025

86%
86% of insights leaders say long-term strategy is where they add the most value.
Source: WFA Insight Forum, 2025
FAQs.
Can’t find the answer you’re looking for?
Reach out to our team: hello@timelaps.io.
Can you measure Category Entry Points (CEPs)?
Yes. We build CEPs into the questionnaire, mapping the moments, needs, and occasions that trigger category buying (the "when, where, why" of a purchase). You see which entry points your brand is linked to, where you're losing ground, and which ones are worth competing for.
How do you measure mental availability?
We track how easily your brand comes to mind across those Category Entry Points, not just whether people have heard of it. The output is a clear read on your brand's mental availability versus competitors: how broadly and how strongly you're linked to the moments that drive purchase.
Do you provide category benchmarks beyond competitive intelligence?
Yes. You see your numbers against your named competitive set and against category norms, so a score is never floating without context. You know whether 40% consideration is strong or weak for your category, not just where you sit relative to two rivals.
How is the data collected, and what’s your sample source, size, and representativeness?
We field continuous online surveys through Dynata, a leading global panel. Samples are census-matched on the dimensions that matter for your category, so the people answering reflect your real market. On Scale, that's roughly 4,000 responses per category per year, refreshed monthly, so trends are stable and read in near real time rather than once a quarter.
What quality controls and fraud detection do you use?
Every response runs through multiple layers of quality control: attention and consistency checks, speeding and straight-lining detection, duplicate and bot screening, and fraud filters on the panel side. Low-quality responses are removed before anything reaches your dashboard, so you're acting on clean data.
Is the questionnaire standard or customizable? Does it include CPG-specific topics like packaging, taste, sustainability, and occasion-based usage?
Both. You get a research-grade core that keeps tracking consistent over time, plus custom questions tailored to your brand. For CPG that routinely includes packaging, taste and product perception, sustainability and "better-for-you" claims, and occasion-based usage, so the tracker speaks your category's language.
How do you measure the why behind metric shifts?
When a number moves, the AI Analyst connects it to the underlying drivers: which Category Entry Points, perceptions, audiences, or campaigns shifted alongside it. Instead of only seeing that consideration dropped, you see what moved with it, so you know where to act.
Do you track the full brand funnel and conversion rates between stages?
Yes. We track the full funnel, from awareness to consideration, preference, usage, and advocacy, and the conversion between each stage. That shows you exactly where you're leaking, for example strong awareness but weak conversion to consideration, so you can fix the right stage.
Do you support multi-country tracking with consistent methodology?
Yes. We run the same methodology across every market, with census-matching applied per country, so results are comparable market to market. You can track one region or many and trust that a move in one country means the same as a move in another.
FAQs.
Can’t find the answer you’re looking for?
Reach out to our team: hello@timelaps.io.
Can you measure Category Entry Points (CEPs)?
Yes. We build CEPs into the questionnaire, mapping the moments, needs, and occasions that trigger category buying (the "when, where, why" of a purchase). You see which entry points your brand is linked to, where you're losing ground, and which ones are worth competing for.
How do you measure mental availability?
We track how easily your brand comes to mind across those Category Entry Points, not just whether people have heard of it. The output is a clear read on your brand's mental availability versus competitors: how broadly and how strongly you're linked to the moments that drive purchase.
Do you provide category benchmarks beyond competitive intelligence?
Yes. You see your numbers against your named competitive set and against category norms, so a score is never floating without context. You know whether 40% consideration is strong or weak for your category, not just where you sit relative to two rivals.
How is the data collected, and what’s your sample source, size, and representativeness?
We field continuous online surveys through Dynata, a leading global panel. Samples are census-matched on the dimensions that matter for your category, so the people answering reflect your real market. On Scale, that's roughly 4,000 responses per category per year, refreshed monthly, so trends are stable and read in near real time rather than once a quarter.
What quality controls and fraud detection do you use?
Every response runs through multiple layers of quality control: attention and consistency checks, speeding and straight-lining detection, duplicate and bot screening, and fraud filters on the panel side. Low-quality responses are removed before anything reaches your dashboard, so you're acting on clean data.
Is the questionnaire standard or customizable? Does it include CPG-specific topics like packaging, taste, sustainability, and occasion-based usage?
Both. You get a research-grade core that keeps tracking consistent over time, plus custom questions tailored to your brand. For CPG that routinely includes packaging, taste and product perception, sustainability and "better-for-you" claims, and occasion-based usage, so the tracker speaks your category's language.
How do you measure the why behind metric shifts?
When a number moves, the AI Analyst connects it to the underlying drivers: which Category Entry Points, perceptions, audiences, or campaigns shifted alongside it. Instead of only seeing that consideration dropped, you see what moved with it, so you know where to act.
Do you track the full brand funnel and conversion rates between stages?
Yes. We track the full funnel, from awareness to consideration, preference, usage, and advocacy, and the conversion between each stage. That shows you exactly where you're leaking, for example strong awareness but weak conversion to consideration, so you can fix the right stage.
Do you support multi-country tracking with consistent methodology?
Yes. We run the same methodology across every market, with census-matching applied per country, so results are comparable market to market. You can track one region or many and trust that a move in one country means the same as a move in another.
FAQs.
Can’t find the answer you’re looking for?
Reach out to our team: hello@timelaps.io.
Can you measure Category Entry Points (CEPs)?
Yes. We build CEPs into the questionnaire, mapping the moments, needs, and occasions that trigger category buying (the "when, where, why" of a purchase). You see which entry points your brand is linked to, where you're losing ground, and which ones are worth competing for.
How do you measure mental availability?
We track how easily your brand comes to mind across those Category Entry Points, not just whether people have heard of it. The output is a clear read on your brand's mental availability versus competitors: how broadly and how strongly you're linked to the moments that drive purchase.
Do you provide category benchmarks beyond competitive intelligence?
Yes. You see your numbers against your named competitive set and against category norms, so a score is never floating without context. You know whether 40% consideration is strong or weak for your category, not just where you sit relative to two rivals.
How is the data collected, and what’s your sample source, size, and representativeness?
We field continuous online surveys through Dynata, a leading global panel. Samples are census-matched on the dimensions that matter for your category, so the people answering reflect your real market. On Scale, that's roughly 4,000 responses per category per year, refreshed monthly, so trends are stable and read in near real time rather than once a quarter.
What quality controls and fraud detection do you use?
Every response runs through multiple layers of quality control: attention and consistency checks, speeding and straight-lining detection, duplicate and bot screening, and fraud filters on the panel side. Low-quality responses are removed before anything reaches your dashboard, so you're acting on clean data.
Is the questionnaire standard or customizable? Does it include CPG-specific topics like packaging, taste, sustainability, and occasion-based usage?
Both. You get a research-grade core that keeps tracking consistent over time, plus custom questions tailored to your brand. For CPG that routinely includes packaging, taste and product perception, sustainability and "better-for-you" claims, and occasion-based usage, so the tracker speaks your category's language.
How do you measure the why behind metric shifts?
When a number moves, the AI Analyst connects it to the underlying drivers: which Category Entry Points, perceptions, audiences, or campaigns shifted alongside it. Instead of only seeing that consideration dropped, you see what moved with it, so you know where to act.
Do you track the full brand funnel and conversion rates between stages?
Yes. We track the full funnel, from awareness to consideration, preference, usage, and advocacy, and the conversion between each stage. That shows you exactly where you're leaking, for example strong awareness but weak conversion to consideration, so you can fix the right stage.
Do you support multi-country tracking with consistent methodology?
Yes. We run the same methodology across every market, with census-matching applied per country, so results are comparable market to market. You can track one region or many and trust that a move in one country means the same as a move in another.