
Timelaps for Betting & Prediction Markets
Continuous brand tracking for betting and prediction platforms.
Continuous brand tracking for betting and prediction platforms.
The market is consolidating around a few names, and acquiring a customer costs hundreds. Being the platform that comes to mind the moment someone wants to place a bet, spin, or trade an outcome is what wins. Timelaps tracks awareness, consideration, and preference continuously, in every market you operate, so you see your brand move before it shows up in volume.

Betting and prediction platforms know the importance of branding.
As one of the most competitive and trending categories, leaders in betting and prediction markets constantly think about their brand and community.
Legacy brand tracking is breaking.
Sentiment moves with every game, election, and headline. Legacy tracking audits quarterly. A dozen news cycles too late.
Slow time to value.
Slow time to value.
Slow time to value.
Price tags built for multi-billion
incumbents, not challengers.
Price tags built for multi-billion
incumbents, not challengers.
Price tags built for multi-billion
incumbents, not challengers.
Social buzz mistaken for real,
representative demand.
Social buzz mistaken for real,
representative demand.
Social buzz mistaken for real,
representative demand.
Require additional resources
to make sense of the data.
Require additional resources
to make sense of the data.
Require additional resources
to make sense of the data.
A viral moment you can feel but cannot measure.
A viral moment you can feel but cannot measure.
A viral moment you can feel but cannot measure.
Insights that arrive after the decision.
Insights that arrive after the decision.
Insights that arrive after the decision.


Brand tracking on auto-pilot.
Brand intelligence, reimagined for betting and prediction platforms.

Cheaper
5x more accessible than traditional alternatives.

Better
Research-grade insights from 4,000 real consumers.

Faster
Set up in days.
Always-on. Self-updating.

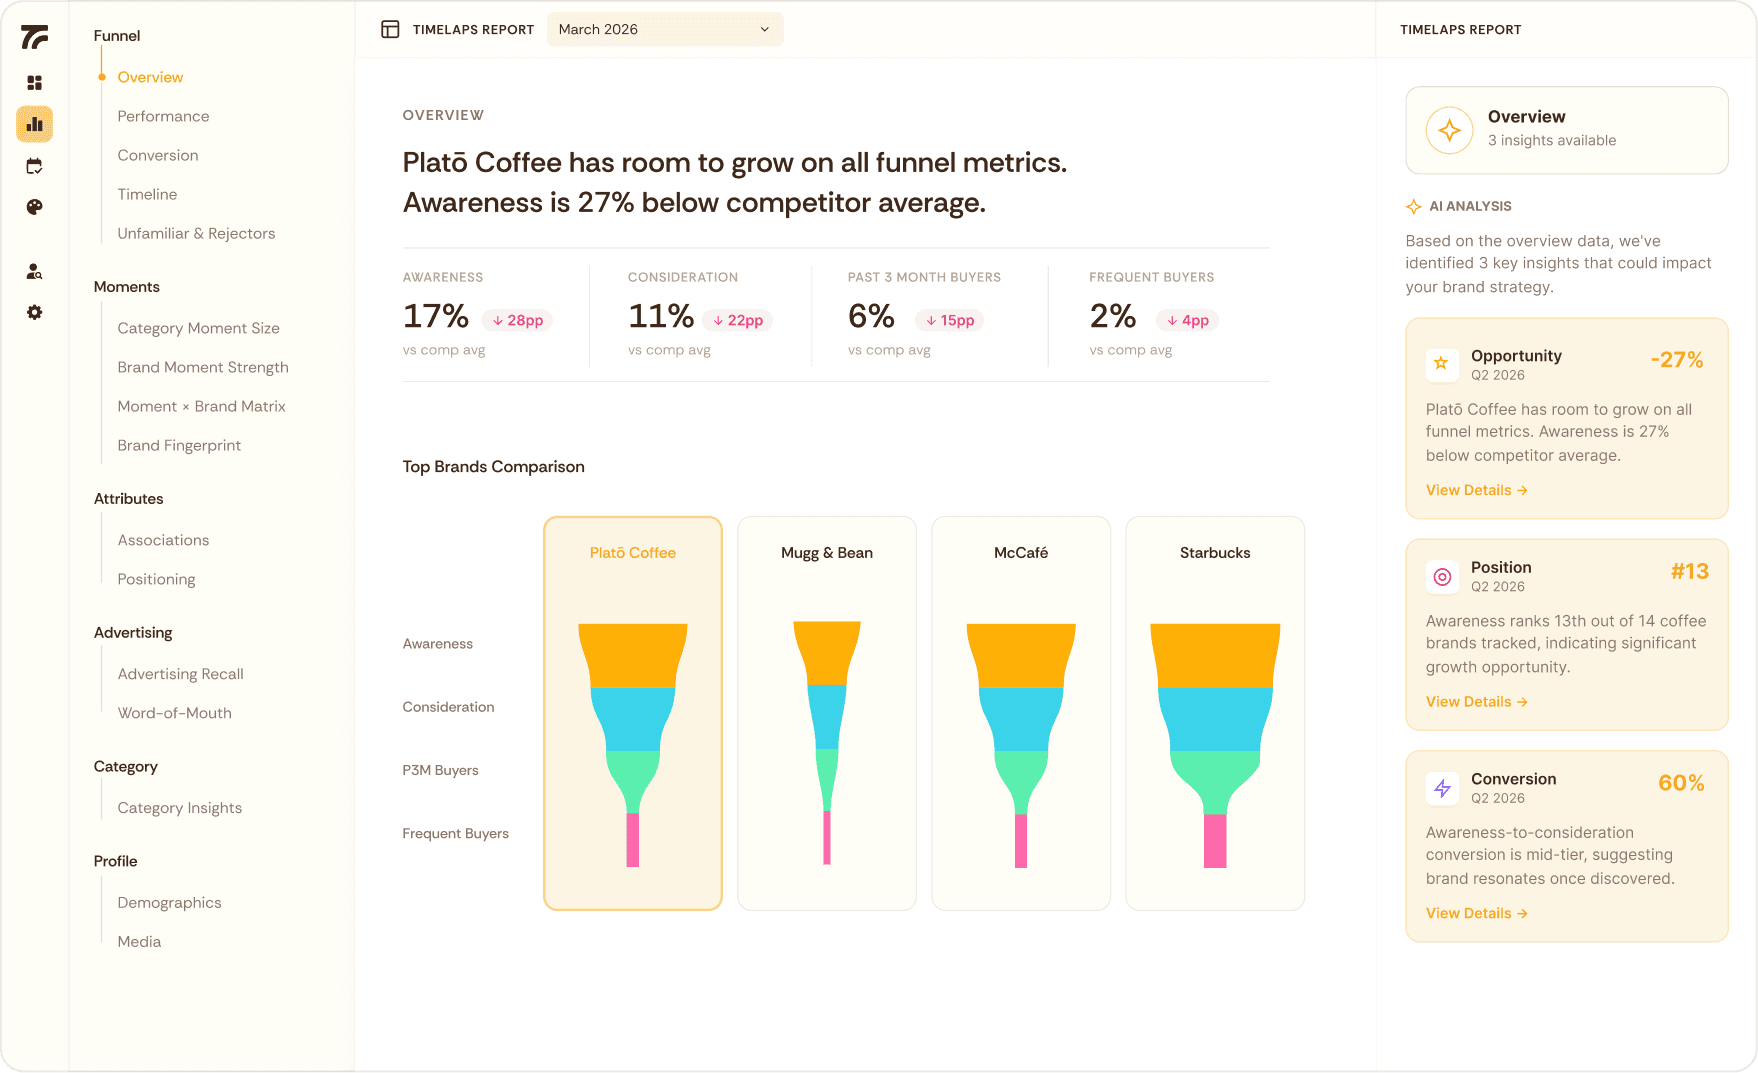
What makes Timelaps different?
What makes Timelaps different?
Timelaps is a modern brand tracking and insight platform designed to replace slower, more expensive traditional agency tracking with always-on insights. The founders come from over 20 years in research and have supported over 150 enterprise and challenger brands.
Without Timelaps
Slow. Expensive. Stale.
How traditional brand tracking holds the category back.

3-6 months to first insight.
Quarterly updates. Decisions made with out of date data.
Six-figure price tags. Most companies are priced out.
Rigor depends on which analyst you get.
Insights buried in dense PPTs.
With Timelaps
Real-time. Accessible. Always-on.
How innovative betting platforms and prediction markets actually operate.

Set up in days, not months.
Always-on. Continuous tracking.
At least 5x more affordable than traditional agencies.
Research-grade with the latest brand science built-in.
Board-ready, self-updating dashboard.

Without Timelaps
Slow. Expensive. Stale.
How traditional brand tracking holds the category back.
3-6 months to first insight.
Quarterly updates. Decisions made with out of date data.
Six-figure price tags. Most companies are priced out.
Rigor depends on which analyst you get.
Insights buried in dense PPTs.
With Timelaps
Real-time. Accessible. Always-on.
How innovative betting platforms and prediction markets actually operate.
Set up in days, not months.
Always-on. Continuous tracking.
At least 5x more affordable than traditional agencies.
Research-grade with the latest brand science built-in.
Board-ready, self-updating dashboard.
Without Timelaps
Slow. Expensive. Stale.
How traditional brand tracking holds the category back.
3-6 months to first insight.
Quarterly updates. Decisions made with out of date data.
Six-figure price tags. Most companies are priced out.
Rigor depends on which analyst you get.
Insights buried in dense PPTs.
With Timelaps
Real-time. Accessible. Always-on.
How innovative betting platforms and prediction markets actually operate.
Set up in days, not months.
Always-on. Continuous tracking.
At least 5x more affordable than traditional agencies.
Research-grade with the latest brand science built-in.
Board-ready, self-updating dashboard.
Fast set-up,
ongoing value.
Onboard in days. Get actionable insights from real consumers in your category continuously.

01
Set up your tracker
Our AI analyst and brand research expert co-design your study. Tailored to your brand, category, and market.
02
03
04
Fast set-up,
ongoing value.
Onboard in days. Get actionable insights from real consumers in your category continuously.
01
Set up your tracker
Our AI analyst and brand research expert co-design your study. Tailored to your brand, category, and market.
02
Always-on fieldwork
Your tracker never stops collecting. Quality-controlled responses from 4,000+ real consumers in your category are selected.
03
Continuous insights
Your dashboard self-refreshes monthly with actionable insights and beautiful visualizations.
04
Share & Act
Share a dynamic storytelling dashboard, instead of a stale PDF, directly with your team.
Fast set-up,
ongoing value.
Onboard in days. Get actionable insights from real consumers in your category continuously.
01
Set up your tracker
Our AI analyst and brand research expert co-design your study. Tailored to your brand, category, and market.
02
Always-on fieldwork
Your tracker never stops collecting. Quality-controlled responses from 4,000+ real consumers in your category are selected.
03
Continuous insights
Your dashboard self-refreshes monthly with actionable insights and beautiful visualizations.
04
Share & Act
Share a dynamic storytelling dashboard, instead of a stale PDF, directly with your team.
Why betting and prediction platforms choose Timelaps.
See where you stand the moment money goes on the line, so acquisition spend stops flying blind.

Own the moments people bet, spin, or trade.
World Cup. The Olympics. NBA Finals. Election night. Track which of these moments (category entry points) your brand owns, and find the big ones nobody has claimed to maximize ROI.

Make acquisition spend accountable.
When spending $300-500 per funded account, every point of brand-driven consideration takes real money off the bill. Track whether your brand is lifting acquisition or you're buying every customer cold.

Separate the real market from the loudest 1%.
Subreddits and X are the vocal 1% venting, not your full user base. Track census-matched reads on how real bettors, players, and traders see you, including perception on payouts, legitimacy, and responsible play.
The Betting & Prediction Markets category wants modern brand intelligence.
Money is pouring in and the field is consolidating around a few names. Yet the brand strength that decides who people reach for goes unmeasured.

380%
Prediction market volume on the two biggest platforms jumped from under $5 billion a month in September 2025 to about $24 billion by April 2026... 380% in 7 months.
Source: Pew Research Center, 2026
380%
60% of brand sales is projected to be done by wholesale, far ahead of brand’s own stores (11%) and websites (6%), pushing brand discovery onto a shelf where you don’t own the data.
Source: Pew Research Center, 2026

$550
Leading sportsbooks now spend $480 to $550 to acquire a single customer, up sharply year over year.
Source: IntelligentHQ, 2026

11%
Only 11% of marketers can comprehensively prove the business impact of their brand marketing
Source: Marketing Week, 2025
FAQs.
Can’t find the answer you’re looking for?
Reach out to our team: hello@timelaps.io.
Can you measure whether we're the platform that comes to mind the moment someone bets, spins, or trades?
Yes. We map the moments people reach for a platform as Category Entry Points: game day, the big fight, election night, a market moving in the group chat. Then we track which platforms come to mind for each. You see where you're the default and where you're an afterthought.
Can you tie brand strength to the cost of acquiring a funded account?
We track awareness, consideration, and preference among bettors and traders continuously, so you can read brand lift against your acquisition numbers. When consideration climbs and cost per funded account falls, you finally have the connection on paper. We also plan to launch more advanced analyses built-in that tie brand to financial metrics.
Can you track perception on payouts, legitimacy, and responsible play, not just awareness?
Yes. We measure whether people believe you pay out, see you as legitimate and regulated, and trust you on responsible play via the 'associations' and 'category entry point' modules. In this category those perceptions are core brand health, and you'll see them move before they show up in churn.
Can you measure the associations that decide whether people see us as safe, serious, or fun?
Yes. We track the specific associations attached to your brand versus the category, so you know whether you own the ground you want, the trusted one, the serious one, the fun one, and where a rival owns it instead. For a prediction market fighting to be seen as a real exchange, that is the whole game.
Can you benchmark us against sportsbooks, casino apps, exchanges, and prediction markets at once?
Yes. You define the competitive set, and it can span all four. As the lines blur between a sportsbook, a casino app, an exchange, and a prediction market, you see who you're actually losing attention to, not just your nearest lookalike.
Can you track by market with consistent methodology as we continue to expand?
Yes. We apply the same methodology everywhere, census-matched per country, so results are meaningful independently and collectively.
Can you measure brand health by demographic segment, like age, region, and income?
Yes. Every metric cuts by demographic segment: age, gender, region, income, and more. You see exactly who you're winning and who you're losing, so you know whether you're reaching the customers you want.
How is the data collected, and what's your sample source, size, and representativeness?
We field continuous online surveys through Dynata, a leading global panel. Samples are census-matched on the dimensions that matter, so respondents reflect your real market, not just your current customers. On Scale, that's roughly 4,000 responses per category per year, refreshed monthly, so trends are stable and read in near real time rather than once a quarter.
What quality controls and fraud detection do you use?
Every response runs through multiple layers: attention and consistency checks, speeding and straight-lining detection, duplicate and bot screening, and panel-side fraud filters. Low-quality responses are removed before anything reaches your dashboard, so you're acting on clean data.
FAQs.
Can’t find the answer you’re looking for?
Reach out to our team: hello@timelaps.io.
Can you measure whether we're the platform that comes to mind the moment someone bets, spins, or trades?
Yes. We map the moments people reach for a platform as Category Entry Points: game day, the big fight, election night, a market moving in the group chat. Then we track which platforms come to mind for each. You see where you're the default and where you're an afterthought.
Can you tie brand strength to the cost of acquiring a funded account?
We track awareness, consideration, and preference among bettors and traders continuously, so you can read brand lift against your acquisition numbers. When consideration climbs and cost per funded account falls, you finally have the connection on paper. We also plan to launch more advanced analyses built-in that tie brand to financial metrics.
Can you track perception on payouts, legitimacy, and responsible play, not just awareness?
Yes. We measure whether people believe you pay out, see you as legitimate and regulated, and trust you on responsible play via the 'associations' and 'category entry point' modules. In this category those perceptions are core brand health, and you'll see them move before they show up in churn.
Can you measure the associations that decide whether people see us as safe, serious, or fun?
Yes. We track the specific associations attached to your brand versus the category, so you know whether you own the ground you want, the trusted one, the serious one, the fun one, and where a rival owns it instead. For a prediction market fighting to be seen as a real exchange, that is the whole game.
Can you benchmark us against sportsbooks, casino apps, exchanges, and prediction markets at once?
Yes. You define the competitive set, and it can span all four. As the lines blur between a sportsbook, a casino app, an exchange, and a prediction market, you see who you're actually losing attention to, not just your nearest lookalike.
Can you track by market with consistent methodology as we continue to expand?
Yes. We apply the same methodology everywhere, census-matched per country, so results are meaningful independently and collectively.
Can you measure brand health by demographic segment, like age, region, and income?
Yes. Every metric cuts by demographic segment: age, gender, region, income, and more. You see exactly who you're winning and who you're losing, so you know whether you're reaching the customers you want.
How is the data collected, and what's your sample source, size, and representativeness?
We field continuous online surveys through Dynata, a leading global panel. Samples are census-matched on the dimensions that matter, so respondents reflect your real market, not just your current customers. On Scale, that's roughly 4,000 responses per category per year, refreshed monthly, so trends are stable and read in near real time rather than once a quarter.
What quality controls and fraud detection do you use?
Every response runs through multiple layers: attention and consistency checks, speeding and straight-lining detection, duplicate and bot screening, and panel-side fraud filters. Low-quality responses are removed before anything reaches your dashboard, so you're acting on clean data.
FAQs.
Can’t find the answer you’re looking for?
Reach out to our team: hello@timelaps.io.
Can you measure whether we're the platform that comes to mind the moment someone bets, spins, or trades?
Yes. We map the moments people reach for a platform as Category Entry Points: game day, the big fight, election night, a market moving in the group chat. Then we track which platforms come to mind for each. You see where you're the default and where you're an afterthought.
Can you tie brand strength to the cost of acquiring a funded account?
We track awareness, consideration, and preference among bettors and traders continuously, so you can read brand lift against your acquisition numbers. When consideration climbs and cost per funded account falls, you finally have the connection on paper. We also plan to launch more advanced analyses built-in that tie brand to financial metrics.
Can you track perception on payouts, legitimacy, and responsible play, not just awareness?
Yes. We measure whether people believe you pay out, see you as legitimate and regulated, and trust you on responsible play via the 'associations' and 'category entry point' modules. In this category those perceptions are core brand health, and you'll see them move before they show up in churn.
Can you measure the associations that decide whether people see us as safe, serious, or fun?
Yes. We track the specific associations attached to your brand versus the category, so you know whether you own the ground you want, the trusted one, the serious one, the fun one, and where a rival owns it instead. For a prediction market fighting to be seen as a real exchange, that is the whole game.
Can you benchmark us against sportsbooks, casino apps, exchanges, and prediction markets at once?
Yes. You define the competitive set, and it can span all four. As the lines blur between a sportsbook, a casino app, an exchange, and a prediction market, you see who you're actually losing attention to, not just your nearest lookalike.
Can you track by market with consistent methodology as we continue to expand?
Yes. We apply the same methodology everywhere, census-matched per country, so results are meaningful independently and collectively.
Can you measure brand health by demographic segment, like age, region, and income?
Yes. Every metric cuts by demographic segment: age, gender, region, income, and more. You see exactly who you're winning and who you're losing, so you know whether you're reaching the customers you want.
How is the data collected, and what's your sample source, size, and representativeness?
We field continuous online surveys through Dynata, a leading global panel. Samples are census-matched on the dimensions that matter, so respondents reflect your real market, not just your current customers. On Scale, that's roughly 4,000 responses per category per year, refreshed monthly, so trends are stable and read in near real time rather than once a quarter.
What quality controls and fraud detection do you use?
Every response runs through multiple layers: attention and consistency checks, speeding and straight-lining detection, duplicate and bot screening, and panel-side fraud filters. Low-quality responses are removed before anything reaches your dashboard, so you're acting on clean data.